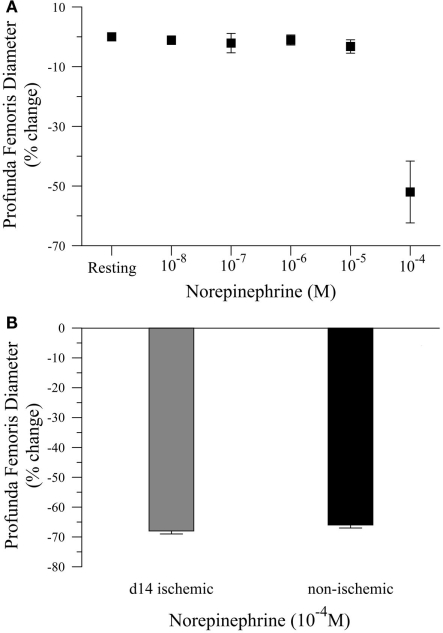
Figure 3.
Vasoconstriction responses to norepinephrine in ischemic and non-ischemic profunda femoris arteries, in vivo. (A) Pilot study measuring the vasoconstriction responses to increasing doses of norepinephrine (NE), applied in 10−x M increments, and (B) vasoconstriction responses to maximal doses of NE (10−4 M) in day-14 ischemic (gray) and contralateral control (black) profunda femoris arteries. Data points are on a relative scale, with resting diameter represented by 0%.

