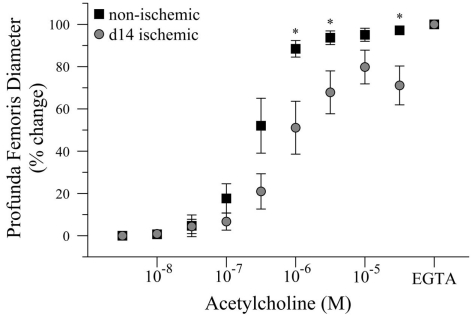
Figure 4.
Dose response curve to acetylcholine in ischemic and non-ischemic distal profunda femoris arteries, ex vivo. Vessels were pressurized to 80 mmHg (baseline) and developed myogenic tone before exposure to the initial dose of Ach (10−8 M); increasing doses were applied at 3 × 10−x M increments. Data points are on a relative scale, with myogenic tone represented as 0% and maximal passive vasodilation represented as 100% (Ca+2-free PSS + EGTA). *p ≤ 0.05 versus day-14 ischemic.

