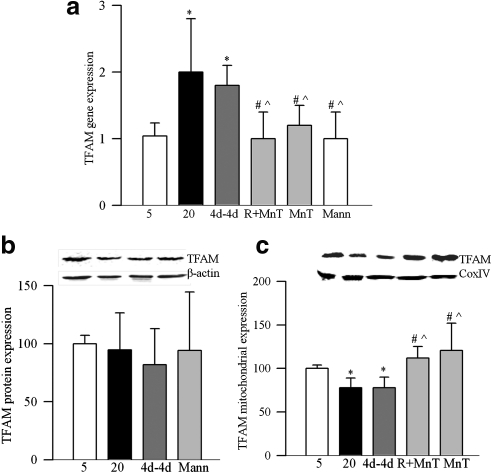
Figure 8.
Reversal of high glucose insult on TFAM in retinal endothelial cells. (a) Gene transcript of TFAM was quantified by real time PCR using 18s rRNA as internal control. TFAM expression was determined in the (b) cell homogenate and (c) in mitochondria by Western blot technique using β-actin (homogenate) and Cox IV (mitochondria) as loading controls. Values are represented as mean ± SD obtained from at least three cell preparations; each preparation analyzed in duplicate. *P < 0.05 compared with 5mM glucose, #P < 0.05 compared with 20mM glucose, and P̂ < 0.05 compared with 4d–4d.

