
Figure 3.
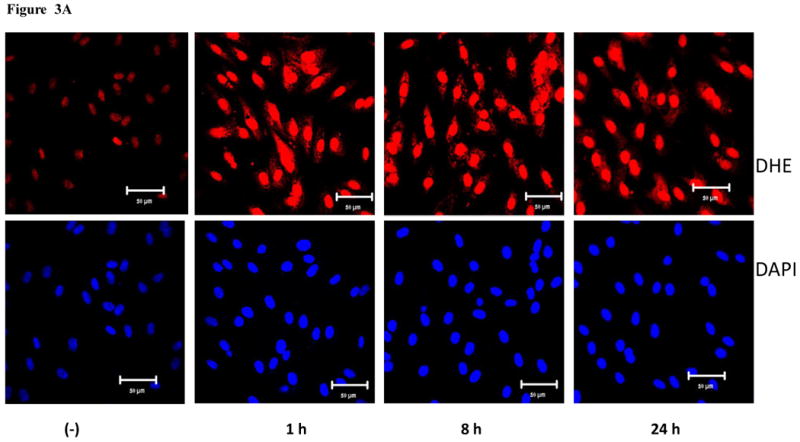


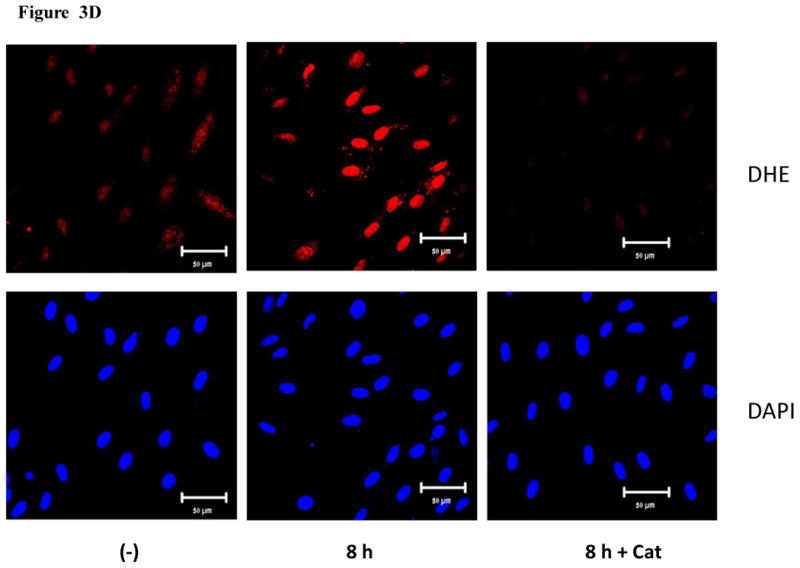

MWCNT induce the production of ROS. A) HMVEC were grown on cover slips, serum-starved, and treated with MWCNT (2.5 μg/ml) for different periods of time as indicated. The production of ROS was determined by pre-treating the cells with DHE as described in Materials and Methods. DAP1 was used to stain cell nuclei. Shown here are representative micrographs from three independent experiments. Scale bar = 50 μm. B) Time-course of ROS production. DHE fluorescence intensity of MWCNT-treated samples relative to non-treated control samples was determined as described in Materials and Methods. Data (mean ± SEM) are representatives of three independent experiments. *, t-test, p ≤ 0.05 versus control, n = 3. C) MWCNT do not induce ROS production in a cell-free system. DHE (5 μM) was mixed with H2O2, MWCNT, or catalase as indicated, followed by measurement of the fluorescence intensity of oxidized DHE using a cytoflour series 4000 fluorescence plate reader. Data represent means ± SEM of three experiments. *, significant at p ≤ 0.05, t-test. D) HMVEC were grown on cover slips, serum-starved, and treated with 2.5 μg/ml MWCNT with or without catalase pretreatment (1000 U/ml) for 8 hr. The production of ROS was determined according to the methods described in Materials and Methods. DAP1 was used to stain cell nuclei. E) Catalase pretreatment (1000 U/ml for 8 hr) inhibits MWCNT (2.5 μg/ml)-induced ROS production in HMVEC. DHE fluorescence intensity was determined as described in Materials and Methods. Data (mean ± SEM) are representatives of three independent experiments. *, t-test, p ≤ 0.05 versus non-treated control, n = 3. DHE = dihyroethidium, DAPI = 4′,6-diamidino-2-phenylindole.