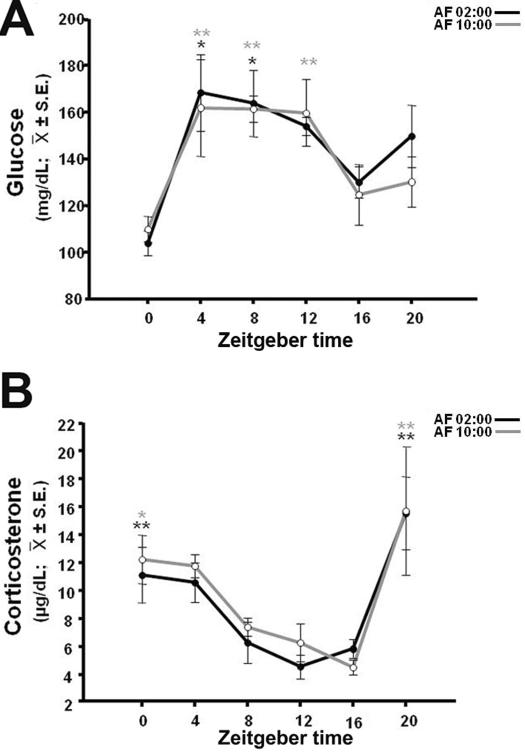
Figure 2.
Temporal profiles of glucose (A) and corticosterone (B) in 7-day-old rabbits artificially fed at 02:00 (AF02:00) or 10:00 (AF10:00) h, from postnatal days 2–7. Significant differences between the highest and the lowest values within same group: * P<0.05, ** P< 0.001. 234×321mm (80 × 80 DPI)

