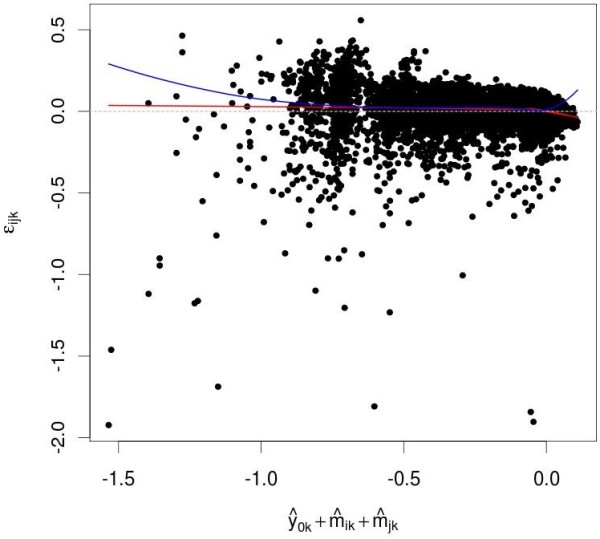
Figure 3.

Fit diagnostics. , the predicted effect of combination (i, j) if there is no interaction, is plotted along the x-axis versus εijk, the difference between observed and predicted value on the y-axis. The red line indicate local regression estimates of local mean of εijk [49]. No significant trends are apparent.
