
Figure 1.
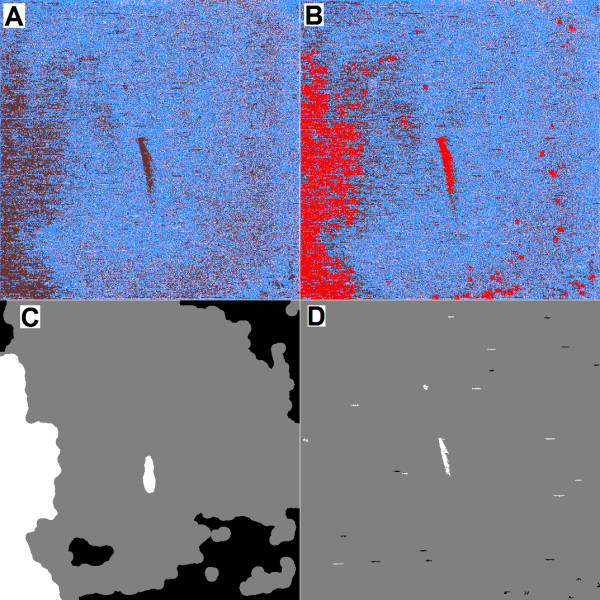
Sample heat map and artifact segmentation result. Panel A shows a heat map of the first variance score generated by caCORRECT for one chip in the West et al. dataset, with dark color indicating poor quality. Panel B shows the variance scores after artifacts have been flagged, with red indicating artifacts, and the rest of the probes colored by their final variance score as in panel A. Panel C and panel D show the compact and diffuse artifacts detected by Harshlighting in black and white with clean data in grey.