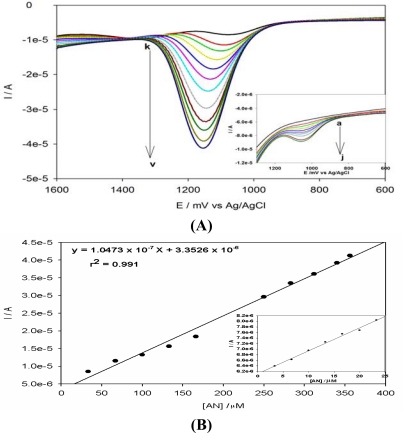
Figure 10.
(A). Anodic difference SWV of PPyox/Ag-AuNPs/GCE in acetonitrile +0.1 M LiClO4 with different anthracene concentration: (a) 0, (b) 3, (c) 6, (d) 10, (e) 13, (f) 16, (g) 20, (h) 23, (i) 26, (j) 28, (k) 33, (l) 66, (m) 100, (n) 133, (o) 166, (p) 200, (q) 233, (r) 250, (s) 283, (t) 312, (u) 340, (v) 356 μM. Inset shows the curves at low concentrations. (B). A calibration plot showing the relationship between current and concentration of anthracene. Inset shows a calibration plot at low concentration.

