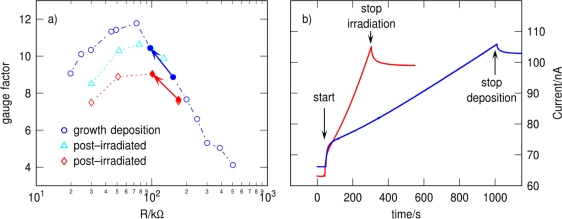
Figure 4.
(a) Measured gauge factors for Pt deposits during growth deposition (circles) and for post-irradiated deposits (triangles, diamonds). The two arrows indicate the displayed in situ conductivity measurements as a function of time during deposition (blue arrow) and post-irradiation (red arrow) shown in (b); (b) Conductivity measurements during deposition (blue) and post-irradiation (red) for a bias voltage of 10 mV.

