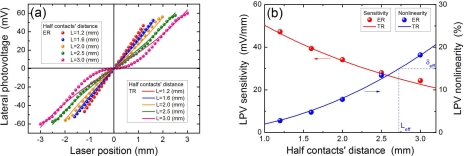
Figure 9.
(a) LPV measurement in MS structure of Ti(6.2 nm)/Si with different contacts’ distance. Solid lines are the plots of Equation (8), where the parameters are chosen as λm = 2.5 (nm). (b) LPV sensitivity and nonlinearity in MS structure of Co(3.5 nm)/Si as a function of half contacts’ distance. Solid lines are the plots of Equation (12) and Equation (14), where the parameters are chosen as λm = 2.5 (nm). Here “ER” and “TR” represent the experimental results and theoretical results, respectively. The laser wavelength and power are 632 nm and 3 mW.

