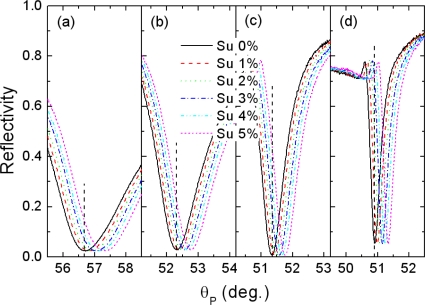
Figure 4.
Measured SPR reflectivity curves with increasing the concentration of sucrose solution for each configuration shown in Figure 3, (a) the conventional SPR, (b) WCSPR, (c) Bi-WCSPR1, and (d) Bi-WCSPR2. The arrow lines indicate the position of reflectivity minima observed at pure water.

