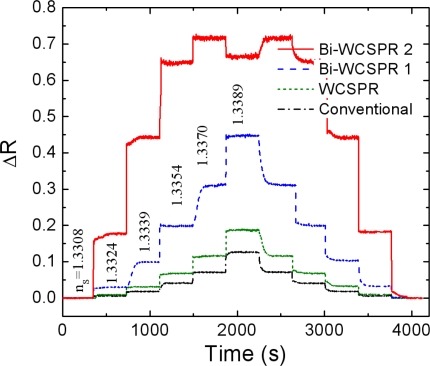
Figure 5.
Temporal responses of the SPR reflectivity minima initially in pure water for each configuration as the sucrose solutions with different concentration were injected to the sensor surfaces. The refractive index of the water-sucrose solution was varied in steps from 1.3308 to 1.3389 and then back to 1.3308. The staircase profiles correspond, from top to bottom, to the responses of Bi-WCSPR2, Bi-WCSPR1, WCSPR, and conventional SPR, respectively.

