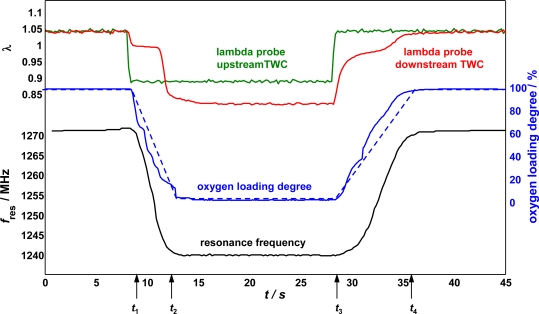
Figure 8.
Lambda probe signals up- and downstream of the TWC (green rsp. red), resonance frequency (fres) during oxygen loading and unloading (black), and measured (blue) and roughly calculated (dotted blue) degree of oxygen loading. Recalculated, partly using data from [18].

