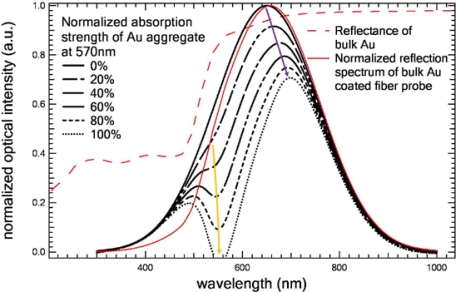
Figure 5.
Calculated reflection spectrum of Au aggregate coated fiber probe as a function of attenuation strength of Au aggregate at 570 nm, red thin curves show reflectance of bulk Au film and normalized reflection spectrum of bulk Au film coated fiber probe. Yellow arrow and purple arrow indicate the trend of the LSPR-induced attenuation and the trend of the longer-wavelength strong peak shift as the LSPR attenuation strength increases, respectively.

