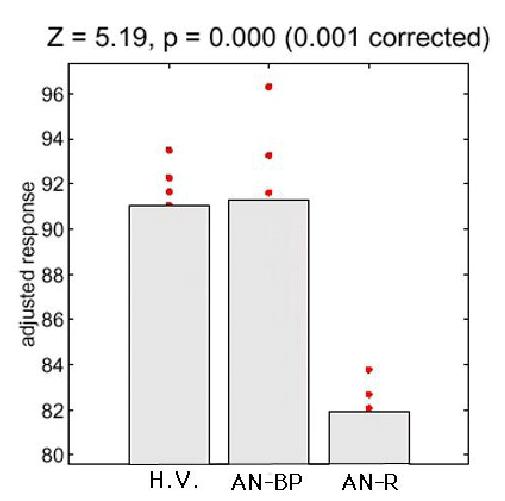
Figure 3.

Comparison of mean values and distributions of adjusted rCBF (response) of the voxels where magnitude of Z-scores showed the greatest reduction in the anterior brain area. The AN-R group shows evidently the lowest values of adjusted rCBF among three groups.
