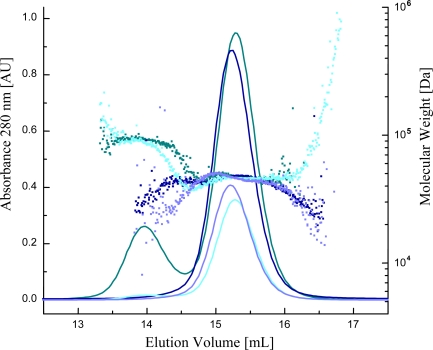
Figure 4.
Gel-filtration light-scattering analysis of Case12. The solid lines represent the signals of the eluted proteins at 280 nm and the small squares represent the calculated molecular masses obtained from the multi-angle light scattering measurements. The colors are coded as following: dark green—Case12 at 16 mg/mL + Ca2+; dark blue—Case12 at 16 mg/mL + EGTA; cyan—Case12 at 4 mg/mL + Ca2+; light blue—Case12 at 4 mg/mL + EGTA.

