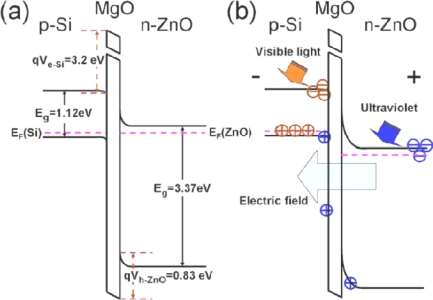
Figure 15.
The energy-band diagrams of n-ZnO/insulator-MgO/ p-Si heterojunctions (a) under zero bias and in dark and (b) under reverse bias and in light illumination. The circles with a line and a cross inside stand for the photogenerated electrons and holes, while the brown and blue relate to the visible and UV excitation in depletion regions of p-Si and n-ZnO, respectively [65].

