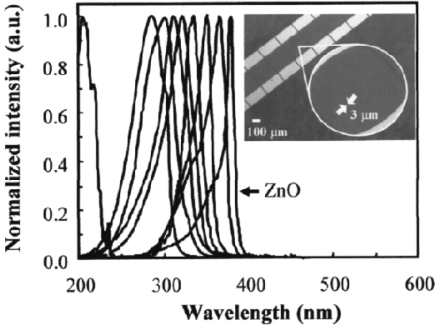
Figure 17.
Normalized spectral response of an array of UV photodetectors based on a composition spread of MgxZn1−xO. The active area of each device was 250 × 220 μm2. Composition variation within each detector is less than 2.4 mol %. The inset of Figure 18 shows an enlarged picture of interdigited electrodes used as detectors. Each finger width and the finger separation is 3 mm [94].

