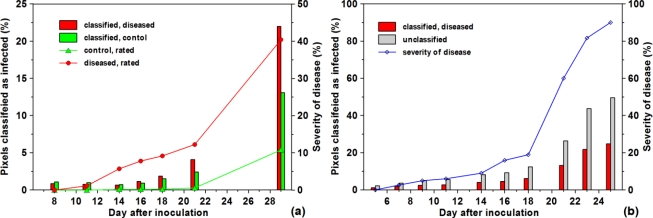
Figure 6.
(a) Results SAM-based classification of infected and control ears (n = 12) in comparison with the severity of disease obtained by visual rating during the course of infection development. (b) Proportion of pixels classified as infected and those unclassified by the SAM algorithm in comparison with the severity of disease obtained by visual rating (n = 6). Results of healthy ears are not shown.

