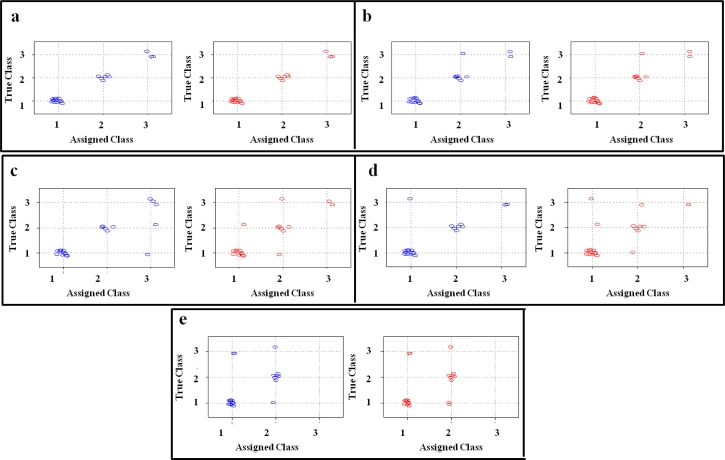
Figure 4.
CART-model performance plots applied to each analytical protocol. Blue dots: samples classification in fitting; Red dots: samples classification in prediction by leave-one-out cross-validation). (a) protocol without the trapping device; (b) protocol with desorption at 180 °C; (c) protocol with desorption at 200 °C; (d) protocol with desorption at 220 °C; (e) protocol with desorption at 240 °C.

