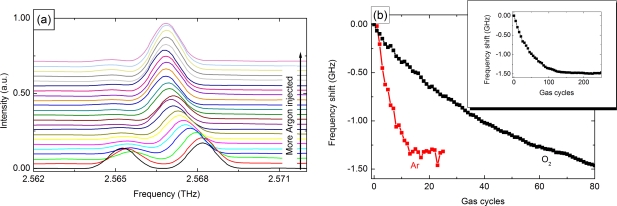
Figure 4.
(a) PhC Spectrum at an applied bias of 18.4 V. There is a clear red-shift with an increasing argon concentration. The two modes visible prior to gas tuning are caused by breaking the six-fold symmetry due to processing imperfections [51]. (b) Line shift for argon and oxygen. Both gases show an almost linear frequency shift with increasing concentration. It saturates at 1.5 GHz or 10−3 times the center frequency.

