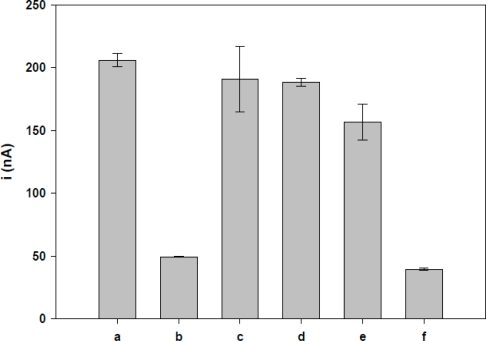
Figure 5.
The differential pulse voltammograms of guanine oxidation at (a) TS-1P (1 μM) immobilized on activated PGE before hybridization, (b) TS-1P (1 μM) immobilized on activated PGE after hybridization with complementary TS-1T (40 nM), (c) with PolyG-NC (40 nM), (d) with TS-2 NC (40 nM) (e) with TS-3 NC (40 nM) and (f) mixture of complementary and non-complementary (PolyG-NC, TS-2 NC and TS-3 NC) (40 nM each). Voltammetric conditions: Scanning potential steps, 20m V/s. Potential amplitude, 50 mV.

