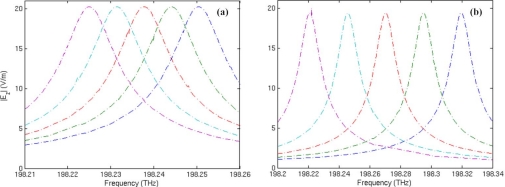
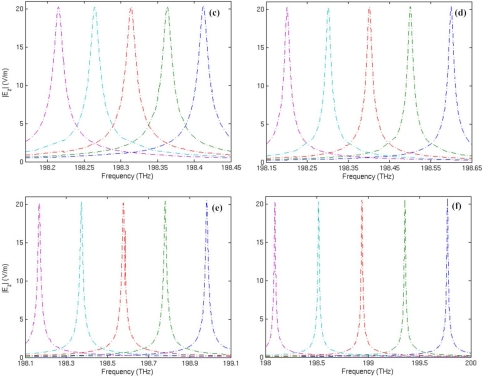
Figure 9.
Resonant frequency spectrum of mode 27 with respect to the change of adsorbed substance permittivity ɛs. From left to right, the curves correspond to ɛs = 1.02, 1.04, 1.06, 1.08 and 1.1, respectively. (a) The traditional microring sensor. (b–f) show the simulation results of the metamaterial sensor with a metamaterial layer in the thickness of 0.06 μm, 0.09 μm, 0.12 μm, 0.15 μm, and 0.18 μm respectively, attached to the inner side.


