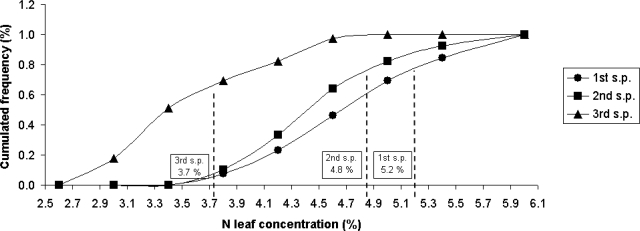
Figure 2.
Cumulated nitrogen concentration frequency chemically measured in relation to the three different sampling periods (s.p. 1st, 2nd and 3rd) and the three thresholds (vertical lines) extracted by the critical-N curve proposed by Tei et al. [9].

