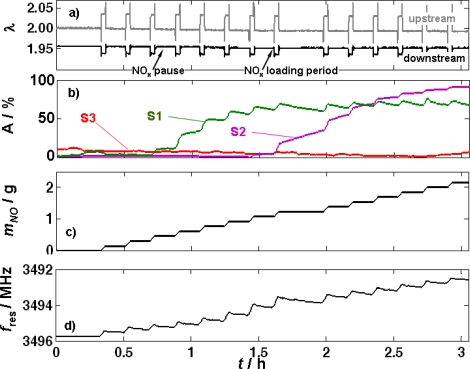
Figure 7.
Time dependent results of a stepwise NOx loading experiment. Experimental data: 320 °C; 14 pulses with 2,750 ppm NOx for 120 s each (NOx loading), followed by NOx pauses of 540 s. (a) λ upstream and downstream of the catalyst, measured by the UEGO sensor. (b) Signals of the impedimetric catalyst sensors (S1, S2, and S3) mounted equidistantly in the catalyst volume. (c) Calculated NOx loading according to Equation (4). (d) Microwave cavity resonance frequency.

