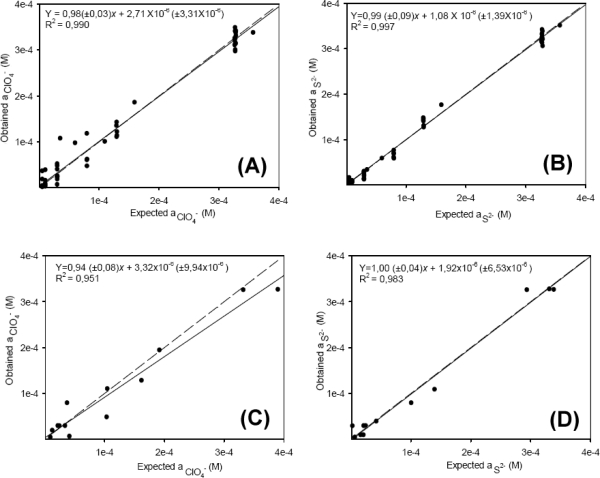
Figure 4.
Modeling performance achieved for the optimized ANN with samples from the training test (A,B) and the external test set: (C,D): on the left, perchlorate ion; on the right, sulfide ion. The dashed line corresponds to ideality, and the solid line is the regression of the comparison data. Uncertainty intervals calculated at the 95% confidence level.

