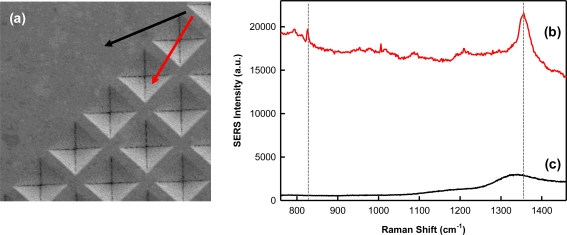
Figure 4.
(a) SEM image of a Klarite® substrate showing the smooth inactive border and the SERS-active patterned grid area. The black and red arrows illustrate the measurement areas for the Raman and SERS spectra, respectively. SERS (b) and Raman (c) spectra recorded for a TNT-doped xerogel film. The vertical lines indicate the peaks related to TNT, which are not evident in the Raman spectra.

