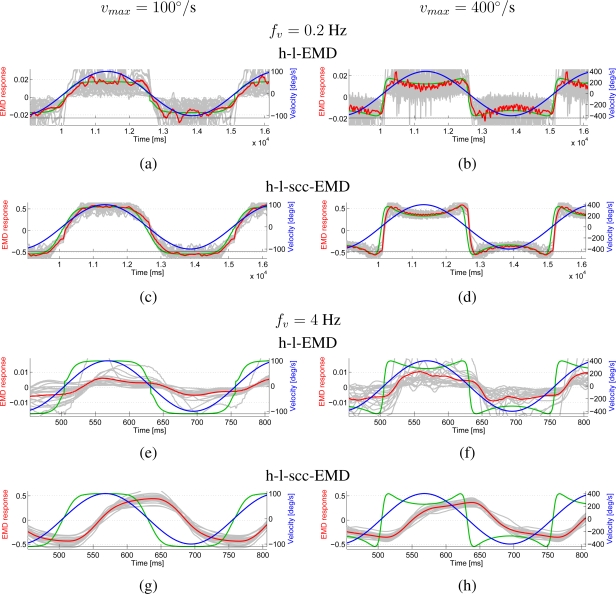
Figure 12.
Responses of the EMD arrays to dynamic stimulation. Blue curves and right scales show the stimulus velocity versus time, red and grey curves and left scales show the responses. Grey lines represent individual simulation results, red lines average results for 4 panorama images and 5 different starting positions. The green curves show the theoretical response predicted from the steady state response curves derived from the previous tests. The velocity of panorama images was oscillated sinusoidally at 0.2 Hz (a–d) or 4 Hz (e–h). The peak velocity was 100°/s (left column) or 400°/s (right column). Responses of two model variants are shown: h-l-EMD (a,b,e,f) and h-l-scc-EMD (c,d,g,h).

