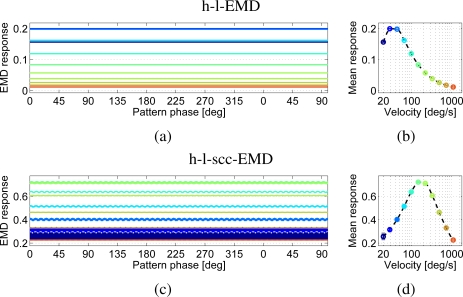
Figure 5.
Responses of an h-l-EMD array (a, b) and an h-l-scc-EMD array (c, d) to a perfect sine pattern. (a) and (c) show the responses versus pattern phase for eleven different velocities after the initial response transient has faded away. (b) and (d) represent the velocity dependence of the mean response amplitude (logarithmic velocity axis). The dashed line represents the interpolated velocity curve. Markers indicate the mean values. Additionally the standard deviation is shown (too small to be visible here). (a, b) h-l-EMD array: The response shows the predicted nearly constant behaviour. (c,d) h-l-scc-EMD array: The response is oscillating. The amplitude of the oscillation is inversely correlated with the velocity.

