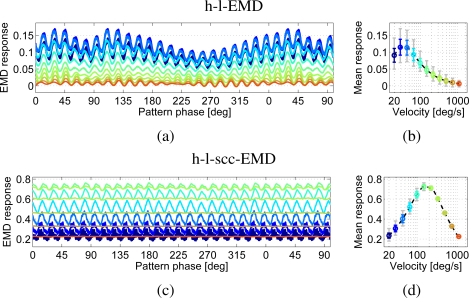
Figure 6.
Responses of an h-l-EMD array (a, b) and an h-l-scc-EMD array (c, d) to a sine pattern with local noise and changes in local intensity. (a) and (c) show the responses versus pattern phase for eleven different velocities after the initial response transient has faded away. (b) and (d) represent the velocity dependence of the mean response amplitude (logarithmic velocity axis). The dashed line represents the approximated velocity curve. Markers indicate the calculated mean values. Additionally the standard deviation (coloured) and the minimum to maximum range of values (grey) are shown. (a, b) h-l-EMD array: The noise leads to a strong response modulation in comparison to the response to the perfect sine pattern. The different velocities cannot be distinguished as easily as is possible for the noise-free pattern. (c, d) h-l-scc-EMD array: The fluctuations in the response are reduced, especially the low-frequency ones, compared to those of the h-l-EMD.

