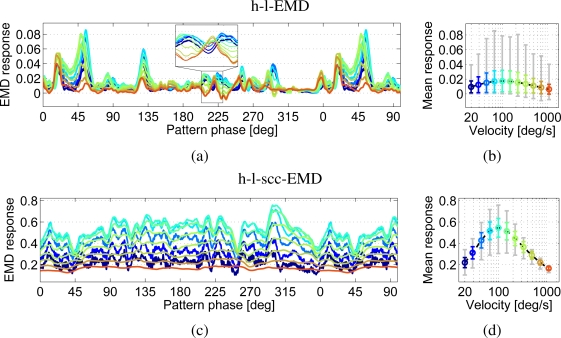
Figure 8.
Time dependent responses to a natural panoramic image (see Figure 4 no. 1, park scene) moving at different constant velocities (a and c), and velocity dependence of averaged responses with standard deviation (coloured) and the minimum to maximum response range (grey) (b and d). (a, b) h-l-EMD array and (c, d) h-l-scc-EMD array. The h-l-EMD array shows a strong pattern dependency. The responses of the (s)cc-EMDs arrays show a smaller pattern dependency which is reduced for larger velocities.

