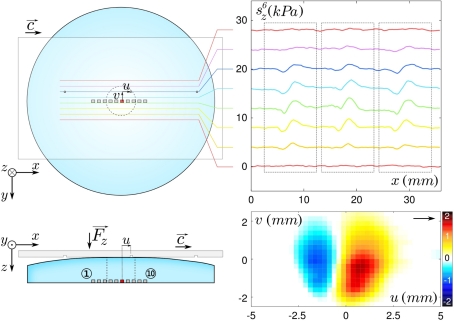
Figure 5.
Generation of the Exploratory Receptive Fields (ERF). (Left) Sketches of the scanning protocol for lines of isolated defects (top: top view, bottom: side view). Dashed circle and lines represent the boundaries of the contact zone, which scale with the actual sensors’ locations. The substrate moves at constant velocity c. The relative position of the nearest defect to a given sensor is denoted (u(t), v(t)). Right-Top Normal stress responses to 3 successive defects for sensor ⑥ (h =3.04 mm, Fz =0.8 N, c = 500 μ m/s). The raw signals, converted in stress unit, are shown for only 8 scanning lines and are shifted vertically from one to the next for clarity. Right-Bottom ERF of the normal stress ςz for sensor ⑥, reconstructed from the average of 14 responses to defects. Color code units are kPa.

