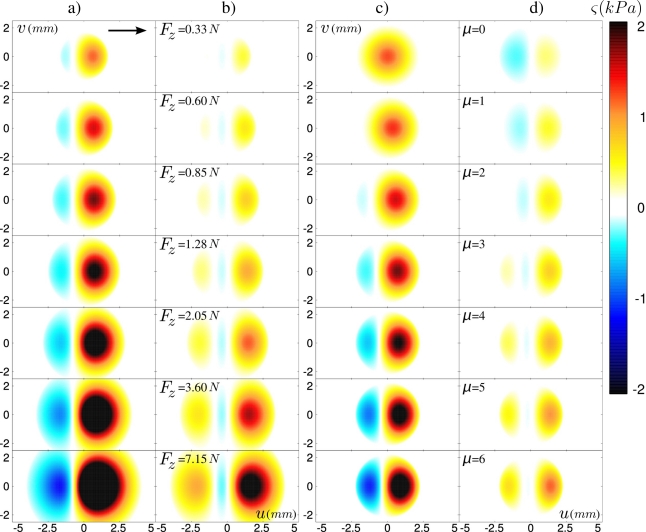
Figure 8.
Evolution of the predicted ERF for a sensor at the center of the contact zone (x =0, y =0) in response to a single defect in (u, v) scanned at constant speed from left to right (h =3.04 mm, c = 500 μ m/s). Two parameters are explored: (a–b) the applied normal force Fz and (c–d) the dynamic friction coefficient μd. Columns (a) and (c) show the normal stress profiles σz, columns (b) and (d) show the shear stress profiles in the direction of motion σx.

