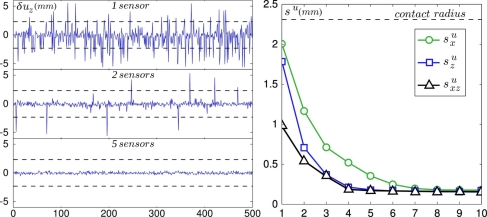
Figure 9.
Detection of the defect’s position along the direction of motion. (Left) Distance between the actual and predicted positions of the defect δuz for 500 random positions of the defect in the contact zone. The predicted positions are derived by comparing the measured normal stress signals to the average stress profiles for 1, 2 and 5 sensors chosen at random for each realization. The dashed horizontal lines on all three plots are boundaries of the contact zone. (Right) Prediction accuracy su as a function of the number of sensors used when only the shear stress signal is used ( , green circles), then when only the normal stress is used ( , blue squares) and finally when both signals are used ( , black triangles). In all three cases, the prediction accuracy converges asymptotically to 150 μm.

