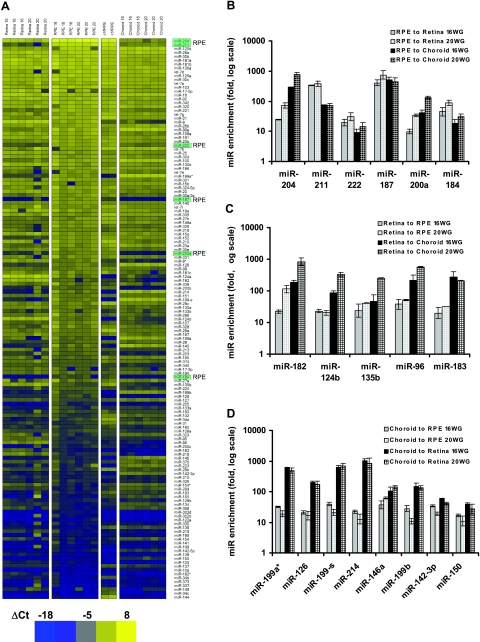
Figure 1.
miRNA expression profile in native hfRPE, neuroretina, choroid, and primary cultures of hfRPE. A) Heat map was plotted in Heatmap Builder1.0 with ΔCt from each miRNA using the mean Ct of miR-16 and let-7a as the reference. Yellow denotes high expression; blue denotes relatively lower expression. Entire data set was assigned to 50 color bins and sorted based on ΔCt in an RPE sample, with high expression (low ΔCt) at top and low expression (high ΔCt) at bottom. At right, the 6 most highly enriched RPE miRNAs are highlighted in light green. Intensity scale: bright blue indicates lowest expression (ΔCt=−18); bright yellow indicates highest expression (ΔCt=8). Highest and lowest expression levels differ by ≈7 × 10⁷-fold (226), which is within the detection range of TaqMan Q-PCR for miRNAs (24). B) Six miRNAs enriched in human RPE. Fold difference was calculated using average ΔΔCt from 3 biological repeats. A miRNA is considered as enriched in RPE if its expression level is significantly higher (≥10-fold) than that in neuroretina and choroid at both 16 and 20 WG. Student’s t test was run for each of the 4 pairs of comparison (P<0.05, 2-tailed, unpaired, unequal variance). C, D) Five miRNAs enriched in human neuroretina (C) and 8 miRNAs enriched in human choroid (D). Fold difference was calculated using the same criteria as for RPE in A.

