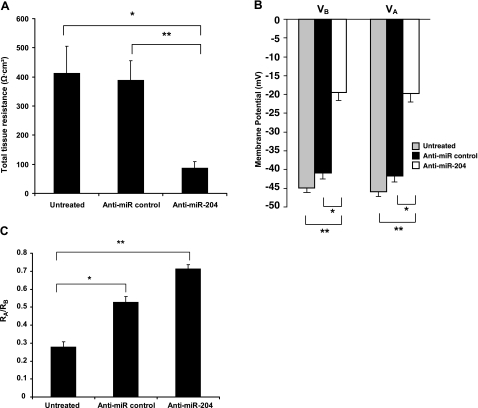
Figure 12.
Anti-miR-204 induced changes in membrane voltage and resistance in primary cultures of hfRPE. In these experiments, the initial TER of the Transwells were uniform as measured by EVOM (866±51 Ω · cm2; n=20). A) TER was measured after mounting confluent monolayers in a modified Üssing chamber. Data are means ±se (n=7). *P < 0.05; **P < 0.005. B) Membrane potentials and resistances were measured using intracellular microelectrode recording techniques (see Materials and Methods): VA, apical membrane potential; VB, basolateral membrane potential. *P < 2 × 10⁻¹⁰; **P < 2 × 10⁻¹³. C) RA/RB, ratio of apical-to-basolateral membrane resistance. *P < 3 × 10⁻⁵; **P < 10−13.

