Figure 2.
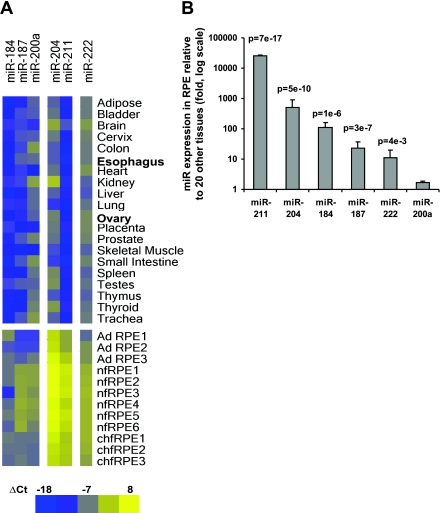
Comparison of the 6 enriched miRNAs in native hfRPE, adult RPE, hfRPE primary culture, and a panel of 20 normal human tissues (Materials and Methods) using qRT-PCR. A) Heat map of ΔCt for 6 miRNAs in 20 normal tissues, 3 native adult human RPE (AD RPE), 5 native fetal RPE (nfRPE), and 3 primary cultures of native hfRPE (chfRPE). Because the expression for miR-16 is more consistent than that for let-7a across this sample of different tissues, it was used in the normalization for ΔCt in each tissue. B) miRNA expression in cultured hfRPE (n=3) compared with the average of miR expression levels in 20 tissues using the ΔΔCt method. P value is based on Student’s t test. Intensity scale: bright blue indicates lowest miRNA expression (ΔCt=−18); bright yellow indicates highest miRNA expression (ΔCt=8). These experiments were performed before the pooled 16 and 20 WG expression data and therefore do not include miR-200b and miR-221.

