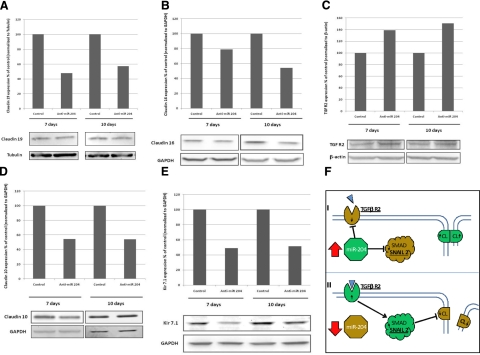
Figure 9.
Immunoblot analysis of protein regulation by miR-204. A–E) Confluent monolayers of hfRPE cell culture were transfected with anti-miR-204 or anti-miRNA negative control oligonucleotide. Cells were collected on d 7 and 10, and 20 μg of total proteins was loaded and electrophoresed. Antibody-specific bands for claudin 19 (A), claudin 16 (B), TGF-βR2 (C), claudin 10 (D), and Kir7.1 (E) are ∼29, 26, 73, 22, and 40 kDa, respectively; GAPDH or β-actin was used as a loading control. Transfection with anti-miR-204 decreased protein expression of claudin 19, claudin 16, claudin 10, and Kir7.1. In contrast, the protein level of TGF-βR2 was increased compared with the negative control. Data are representative from ≥3 separate experiments. F) Schematic model of the miR204 regulatory pathway affecting claudin (CL) expression.

