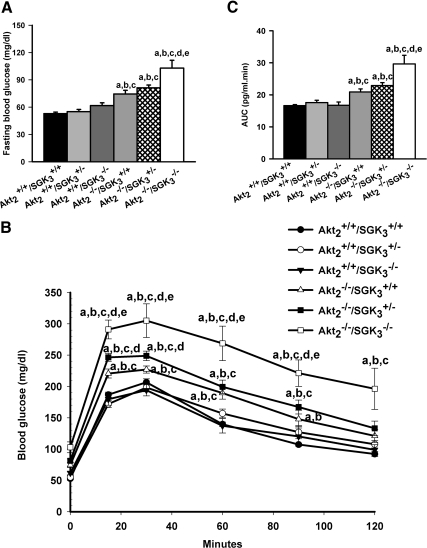
Fig. 1.
Fasting blood glucose and glucose tolerance in DKO mice. A, Blood glucose levels from animals (n ≥7 per genotype) fasted overnight were measured by glucometer. B, Intraperitoneal glucose tolerance test at 7–9 wk of age. Male mice were fasted overnight and subjected to ip injection of 1 g/kg glucose. (n = 7 per genotype). Blood glucose levels were tested at 0, 15, 30, 60, 90, and 120 min. C, Quantification of glycemic excursions as area under the curve. Data are represented as mean ± sem. a, P < 0.05 vs. Akt2+/+/SGK3+/+; b, P < 0.05 vs. Akt2+/+/SGK3+/−; c, P < 0.05 vs. Akt2+/+/SGK3−/−; d, P < 0.05 vs. Akt2−/−/SGK3+/+; e, P < 0.05 vs. Akt2−/−/SGK3+/−.

