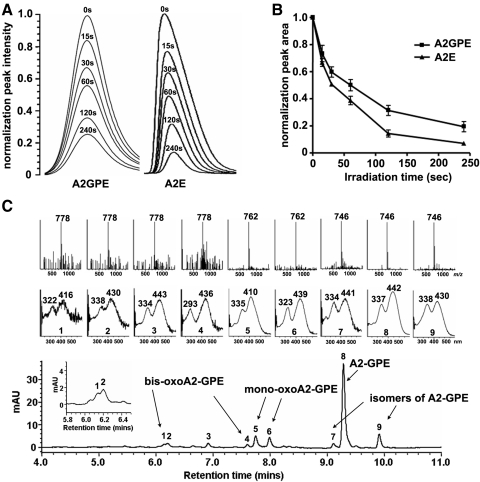
Figure 7.
Photo-oxidation of A2-GPE and A2E. (A) Photo-oxidation-associated consumption of A2-GPE presented as declining chromatographic peak intensity (absorbance monitoring) with different irradiation (430 nm) times (seconds, s). (B) Plots of normalized peak areas. (C) Representative reversed-phase UPLC chromatogram with selected ion monitoring of mass (Inset, above) and absorbance (Inset, below) (gradient A). A2-GPE, m/z 746; monooxoA2-GPE, m/z 762; bisoxoA2-GPE, m/z 778.

