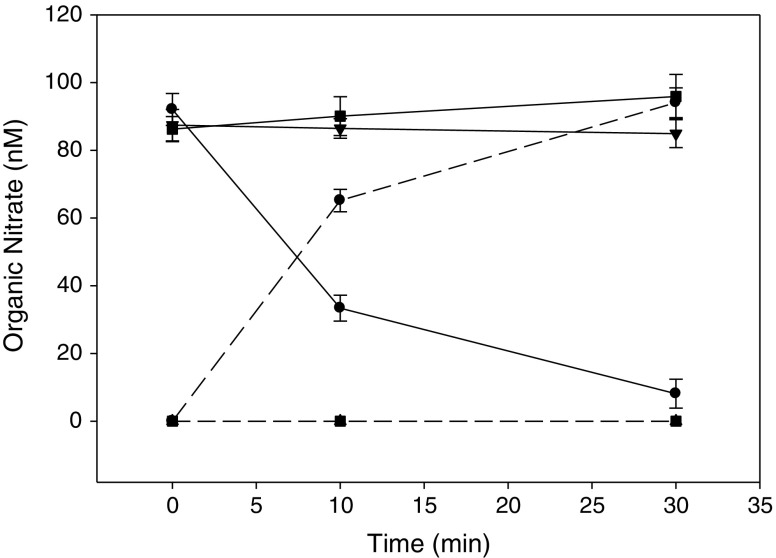
Fig. 3.
NTG degradation and 1,2-GDN production by hALDH2 WT or mutants at 4°C. Black circle represents WT, black square represents C319A, black down-pointing triangle represents E504K, solid lines represent NTG and dashed lines represent 1,2-GDN. Data are expressed as mean ± SD, n = 3. (***p < 0.001 WT vs. mutants for NTG and 1,2-GDN)

