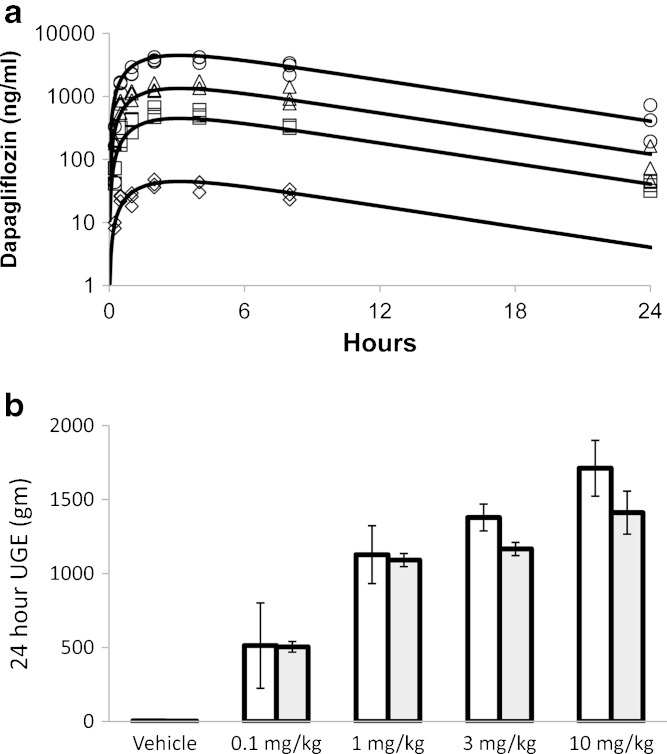
Fig. 1.
Single-dose plasma pharmacokinetics a and UGE pharmacodynamics b of dapagliflozin at four dose levels in rats. Lines of a and shaded bars of b represent model fits. Open symbols of a represent individual observations at doses of 0.1 (triangle), 1 (square), 3 (triangle), and 10 mg/kg (circle). Open bars of b (mean ± S.D.) represent mean experimental observations (±S.D.). UGE over 24 h in the vehicle group was 4.1 ± 0.6 g

