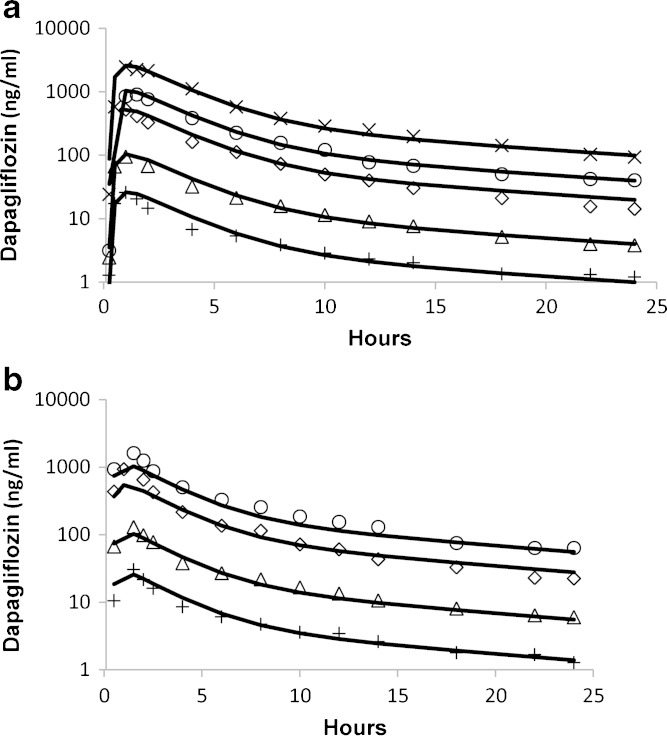
Fig. 2.
Mean dapagliflozin pharmacokinetics in healthy subjects following single a and multiple daily doses b as obtained from the literature (26). Symbols represent doses of 2.5 (plus sign), 10 (triangle), 50 (diamond), 100 (circle), and 250 mg (multiplication sign). Lines represent model fits

