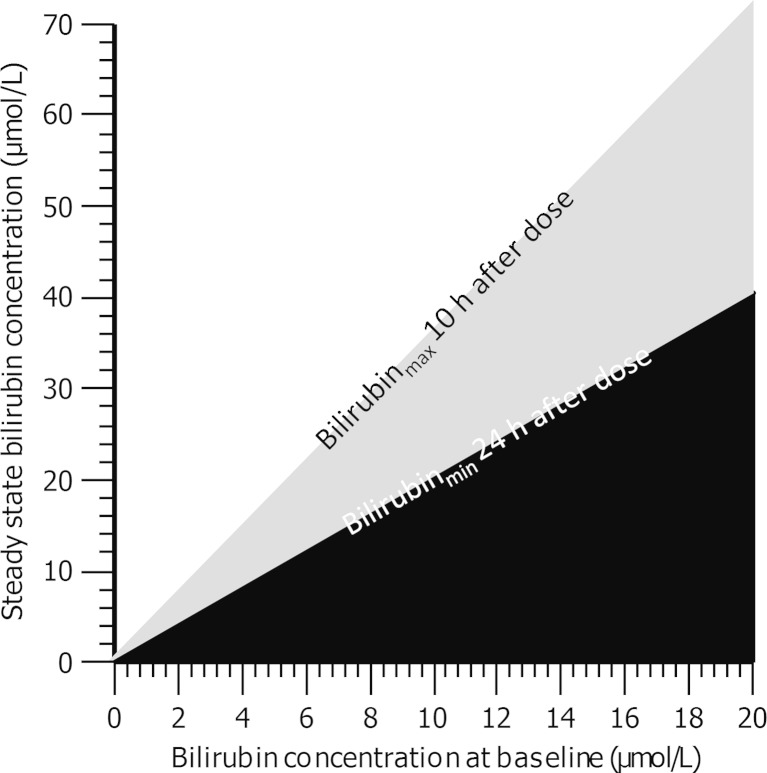
Fig. 5.
Nomogram of the linear relationship between the baseline bilirubin concentrations and the final steady-state bilirubin concentrations after atazanavir therapy initiation. The black area represents bilirubin steady state levels associated with atazanavir exposure below the minimal effective concentration of 0.2 μmol/L. The borders of the grey area represent maximal (10 h after atazanavir dose) and the minimal (24 h after atazanavir dose) bilirubin steady-state concentrations associated with atazanavir exposure at MEC. The white area represents bilirubin levels assosiated with atazanavir concentrations over MEC

