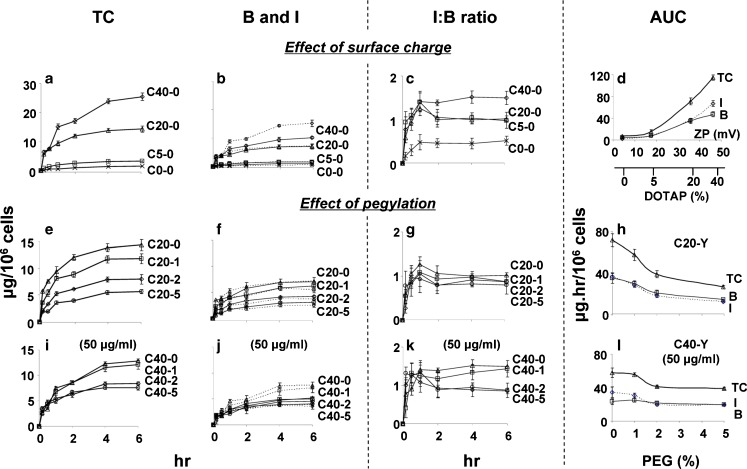
Fig. 3.
Effect of surface charge and pegylation on membrane-binding and intracellular bioavailability: time course study. TC concentration of cell-associated total liposomes, B concentration of membrane-bound liposomes, I concentration of internalized liposomes, I/B ratios and AUC were calculated. CX-Y X = mol.% DOTAP, Y = mol.% PEG. Mean ± SD, n = 3. Some SD are smaller than symbols. a–c Liposomes without pegylation. C0-0 (ex symbol), C5-0 (square), C20-0 (triangle), and C40-0 (diamond). e–g C20-Y liposomes with 0-5% pegylation. C20-0 (triangle), C20-1 (square), C20-2 (diamond), C20-5 (circle). i–k C40 liposomes with 0–5% pegylation. C40-0 (triangle), C40-1 (square), C40-2 (diamond), C40-5 (circle). d Effect of surface charge on AUC of TC, b, i the x-axis represents ZP and the corresponding mol.% DOTAP. h, l Effect of pegylation on AUC of TC, b, i for C20-Y and C40-Y liposomes. For all figures: solid lines denote the B values and dotted lines denote the I values. The initial extracellular liposome concentration was 100 μg/ml, except where indicated

