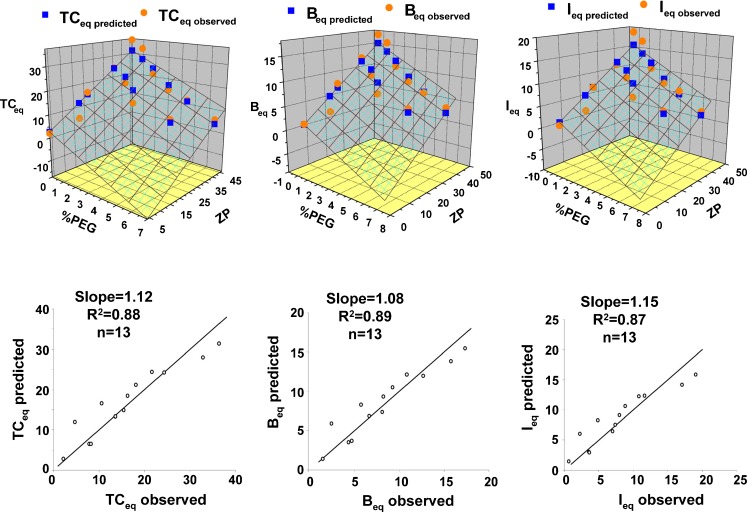
Fig. 6.
Liposome binding and internationalization: surface charge and pegylation as correlates. TC eq concentration of cell-associated total liposomes at equilibrium (4 h), B eq concentration of membrane-bound liposomes at equilibrium (4 h), I eq concentration of internalized liposomes at equilibrium (4 h). Observed values for TCeq, B eq, and I eq from Table III were regressed with ZP and %PEG to determine the best linear regression equation without intercept. Liposome amounts as functions of ZP and %PEG are shown in 3D plots. The relationship between regression-predicted concentrations and observed concentrations are shown in 2D plots. Units for all concentrations are μg/106 cells. The regression equations, showing regression coefficients ±95% confidence limits, are: TCeq, predicted = (−2.88 ± 0.99) × %PEG + (0.68±0.08) × ZP, R 2 = 0.97; B eq, predicted = (−1.36±0.44) × %PEG + (0.33±0.04) × ZP, R 2 = 0.97; I eq, predicted = (−1.52±0.56) × %PEG + (0.34±0.05) × ZP, R 2 = 0.96

