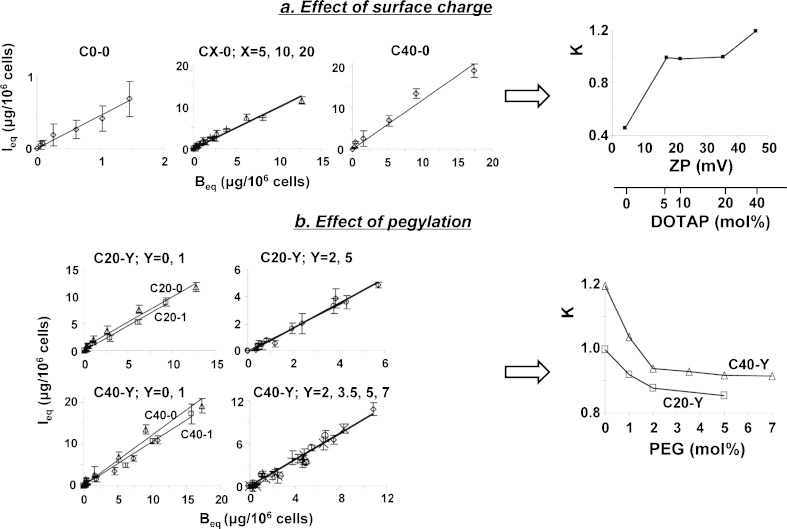
Fig. 7.
Analysis of internalization of membrane-bound liposomes: effects of surface charge and pegylation on the I eq-to-B eq proportional constant K. Figures located on the left of arrows are plots of I eq versus B eq data at different initial extracellular concentrations (5 to 200 μg/ml, data shown in Fig. 5). a C0-0 (diamond), C5-0 (square), C10-0 (plus sign), C20-0 (triangle), C40-0 (diamond); b triangle C20-0/C40-0, square C20-1/C40-1, diamond C20-2/C40-2, ex symbol C40-3.5, circle C20-5/C40-5, plus sign C40-7. The lines are the best-fitted regressed lines and the slopes are the proportional constants K. Mean ± SD, n = 3. Some SD are smaller than symbols. Plots of K versus surface charge and % pegylation are shown to the right of arrows. Additional results for C50-0 liposomes showed increases similar to those for C40-0 (not shown, see text)

