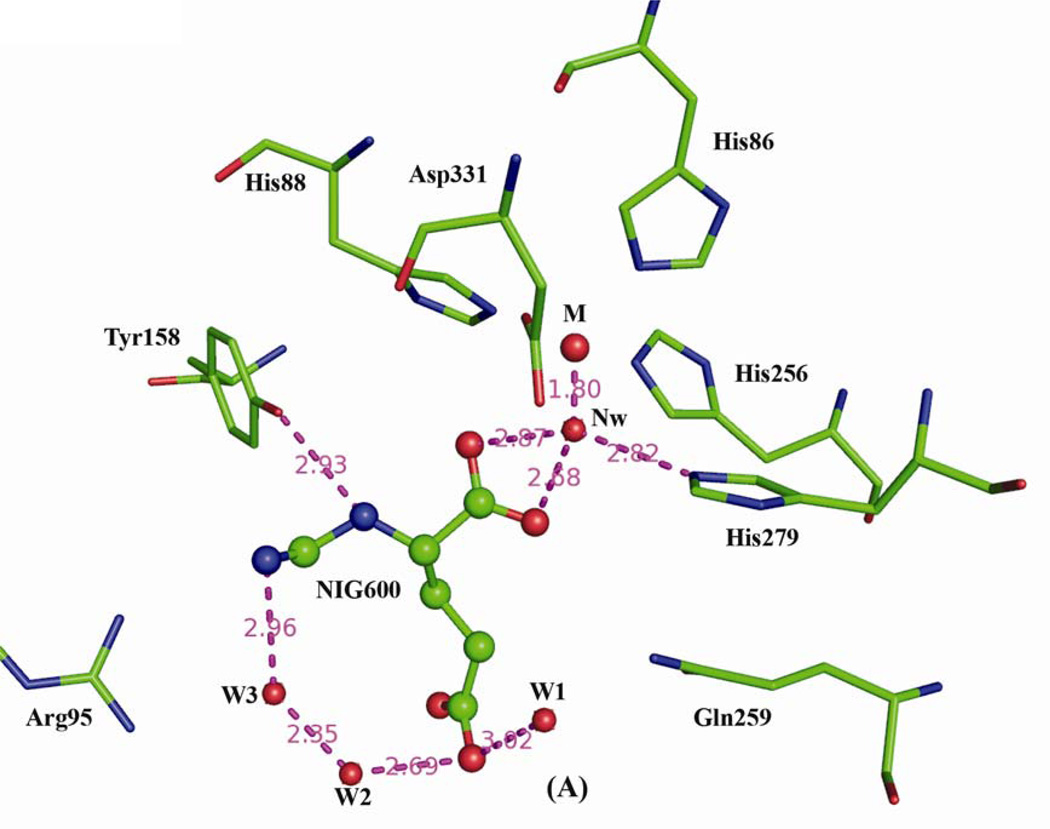
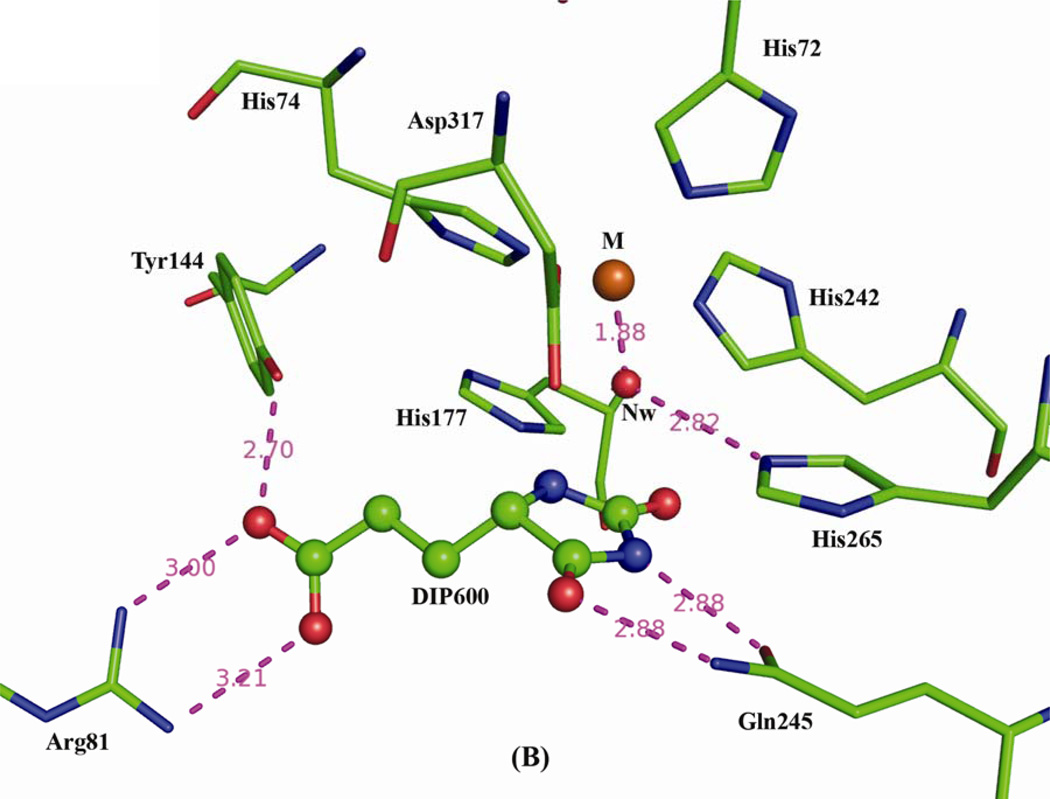
Figure 4.
Active sites of the (A) Enzyme-Product and (B) Enzyme-Inhibitor complexes, shown in similar orientations. Nearby protein residues are shown as color-coded stick figures and ligand atoms as color-coded ball-and-stick figures (C: green, N: blue; O: red) with iron (M: orange) and water molecules (red) as spheres. Nw represents nucleophilic water, while W1-W3 represent structural waters stabilizing product binding.


