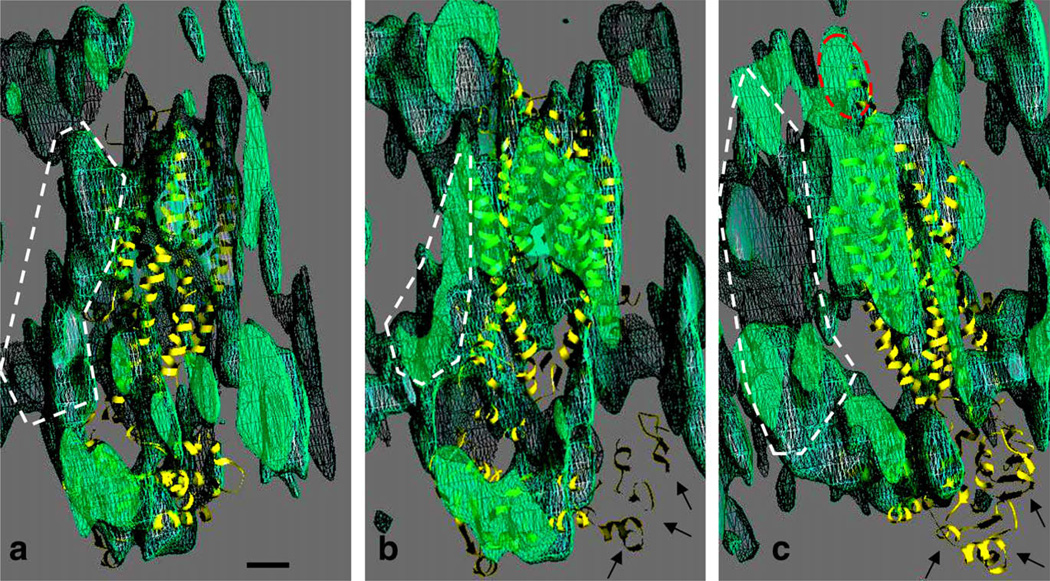
Figure 4.
Comparison of the MRP1 map with the P-gp structural model (yellow ribbon trace). Three sequential slices through the MRP1 map (green netting) are displayed in the same orientation as in panel c of Figure 3. (a) Nearmost slice with the C-terminal half of P-gp. (b) Central slice. (c) Rearmost slice, with the N-terminal half of P-gp. Regions to the left in panels a–c, shown by the white dashed lines, were interpreted as corresponding to the additional TMD0 in MRP1. The fitting of the P-gp model to the MRP1 map (see main text for methodology) places its first NBD in a region of low density (arrows, panels b and c). The scale bar corresponds to 1 nm. (For interpretation of the references to colour in this figure legend, the reader is referred to the web version of this article.)

