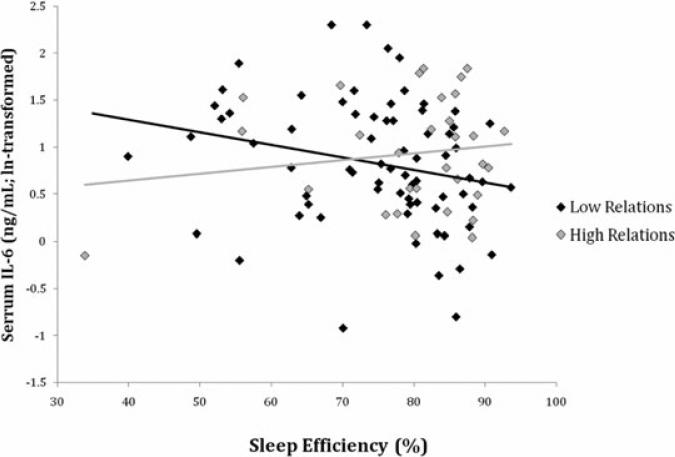
Figure 3.
Scatter plot of actigraphic sleep efficiency predicting IL-6 in men. The statistical interaction between PSQI scores and Positive Relations with Others (Table 5) is illustrated here using the top (“high relations”) and bottom (“low relations”) tertiles of scores from the positive relations scale.

